Mapping Inequality
A promising young researcher collaborates with faculty to map risk factors for incarceration
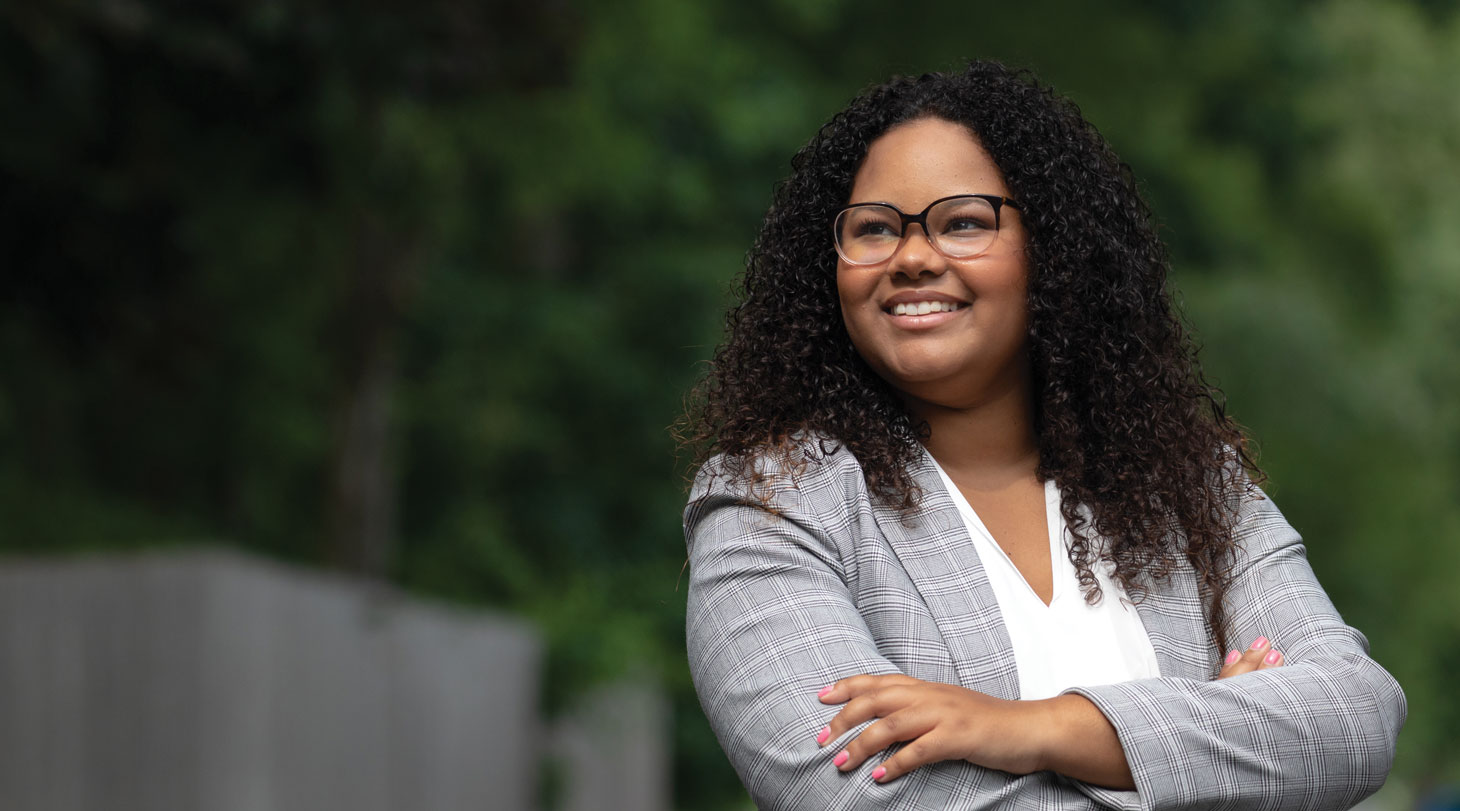
Brianna Franklin, Class of 2022, serves as a research assistant on a project that shows the relationships among race, poverty, and incarceration in Connecticut.
Story by Andrea Grant
Photography by Michael J. Clarke
To what degree does where you’re from determine who you’ll become?
Suffolk University junior Brianna Franklin is collaborating with faculty on an ambitious research project that will combine incarceration data, potential risk factors, and Geographic Information Systems (GIS) mapping to try to determine any relationship.
“In my family a lot of people have been in trouble with the law,” says Franklin, Class of 2022, a sociology and psychology double major from Leominster, Massachusetts. “My father was so smart and had so much potential, but housing was a challenge, and he was in and out of shelters. I feel like that kind of lack of opportunity is one of the main things that drives people to crime.”
As a first-year student, she wrote about her developing interest in research and her desire to make a difference. Her professor read it and recommended Franklin to Sociology Department Chair Erika Gebo, who saw a perfect opportunity to connect a promising student with an incoming faculty member.
Lucius Couloute was an undergraduate studying economics when the killing of Trayvon Martin shook the nation and catalyzed the Black Lives Matter movement.
“Trying to make sense of that, I read The Autobiography of Malcolm X and learned more about society’s inequalities. I could see those disparities at work in the Hartford, Connecticut, area where I grew up,” says Couloute, assistant professor of sociology.
He turned to sociology as a way to understand—and, he hoped, help lessen—racism and economic inequality. His research on the complex relationships among race, poverty, and incarceration is yielding data that he hopes will help change the way society looks at crime, focusing less on punishment and more on prevention through social interventions.
When Couloute joined the Suffolk faculty in 2019, Gebo recommended Franklin as his research assistant. Franklin read up on Couloute’s work.
“He has written papers for the Prison Policy Initiative,” she says, referring to the Massachusetts-based criminal justice policy think tank. “I thought that was really cool because I didn’t even know there was an organization that tries to promote preventive policies.”
Franklin began by compiling and summarizing articles for Couloute. Now she’s helping him sift through dozens of qualitative interviews conducted with formerly incarcerated men. She is fascinated by some of the responses, particularly when subjects talk about what they believe led them into trouble.
“Some people think the flawed system is the main reason they ended up in prison, but others believe they are solely responsible for their own bad decisions,” she says.
Couloute and Franklin’s next project will use quantitative data to explore which camp is (more) correct.
Franklin is helping parse data from the Connecticut Department of Correction, the U.S. Census Bureau, and other government repositories to break down incarceration rates and potential correlated factors—such as education level and poverty rate—by municipality.
Combining the data with GIS mapping will help show “which factors are actually the most critical to crime in Connecticut,” says Michael Acheampong, a professor in Suffolk’s Center for Urban Ecology and Sustainability, who is applying his expertise in data and mapping to the research.
“We have an overlap in our goal to ultimately inform policy,” says Couloute. “We are excited to see where the data takes us.”
Franklin says that the way Couloute and Acheampong are presenting their data will help visual learners grasp the correlations immediately.
“Even though I don’t really know any areas of Connecticut, I can look at the map and understand right away where the problem areas are. I don’t need to sort through the numbers to understand really what’s going on,” she says.
Acheampong agrees.
“By the end of this project, we will have a visual that tells the story.”
Working with Couloute and Acheampong has given Franklin a new plan for her future, one where she can envision continuing the meaningful research she loves.
“I knew that lab scientists get grants to do projects. But before I worked with Professor Couloute I didn’t know there was a viable path for sociologists, too. This project has opened my mind to new possibilities for me,” she says.
For Couloute, mentoring Franklin is an opportunity to pay forward all the advice and encouragement he received during his own academic career.
“Our students are smart; they’re dynamic, curious, and they’re excited to learn. Brianna is a brilliant young scholar who has helped us move forward with our project while she gains hands-on experience working with data and building a research project from the ground up.
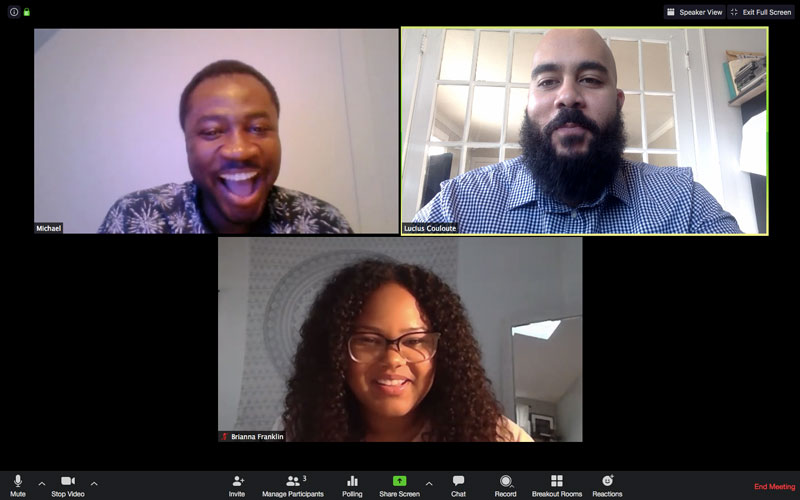
“Michael, Brianna, and myself were strangers before the fall of 2019. Today we are a small but awesome team working on important social research with direct policy implications,” says Couloute.
Courtesy of Lucius Couloute (2)
When Lucius Couloute and Michael Acheampong met last summer at a new-faculty mixer, they realized they could build a bridge between their disciplines and decided to combine their strengths.
While Couloute’s upbringing near Hartford sparked his interest in the sociology of crime and incarceration, Acheampong embraced technology as a way to help his fellow Ghanaians protect their natural resources.
Acheampong was a collegian when oil was discovered in Ghana in 2007, bringing great wealth to parts of the country. Now his research examines the true cost of that development to traditional livelihoods and lifestyles—and to the environment.
Using GIS mapping, Acheampong tracks land use changes to show how oil drilling competes with existing agricultural activity and affects water resources that support rural Ghanaians. His work also shines a light on the environmental impacts of turning forests and farmlands into concrete jungles, such as increased flooding and groundwater contamination. He overlays data onto detailed digital maps, then digs deeper through a process called “ground truthing” by venturing into remote areas to speak with rural farmers and chiefs. The end result is a compelling data-driven narrative that helps give average citizens a voice as the country considers further development.
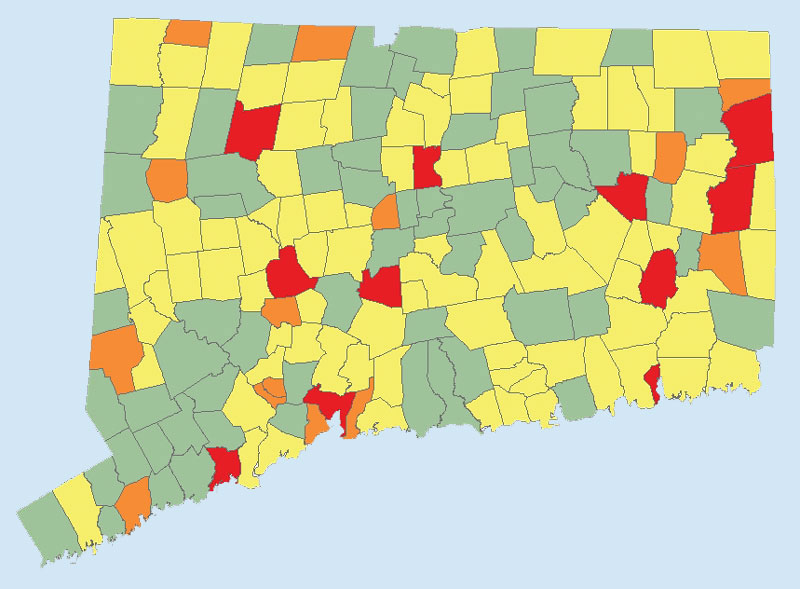
This map below, which combines Couloute’s data using Acheampong’s GIS mapping approach, illustrates differing levels of incarceration rates across Connecticut; cities with higher incarceration rates are in orange and red, those with average incarceration rates are in yellow, and those with below-average incarceration rates are in green.